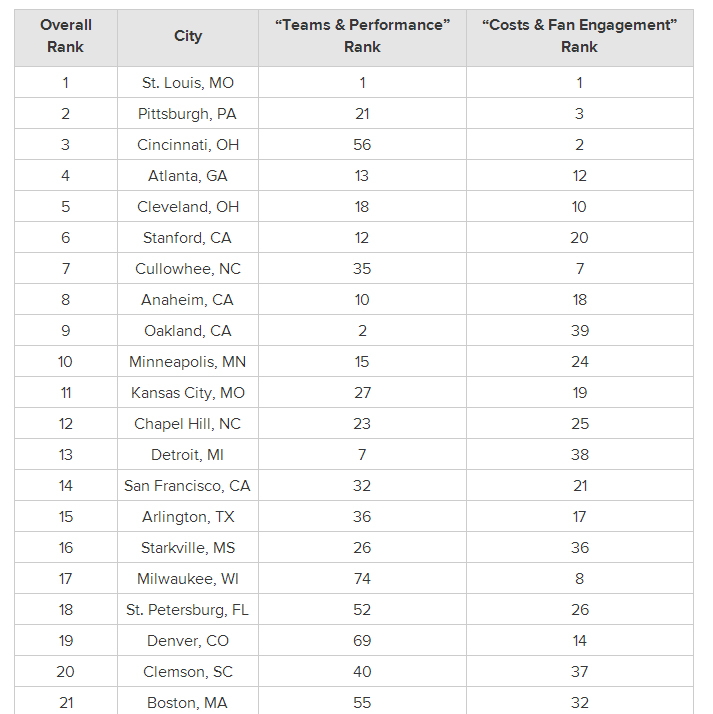
We’re pretty much at a complete loss to understand a ranking of baseball cities today that brings Minneapolis in at No. 10.
It’s not that we’re not convinced Minneapolis is the 10th-best city in America in which to be a baseball fan — although we’re not. It’s just that there are some entries in the survey that make us question its methodology.
Wallet Hub’s survey ranks St. Louis No. 1. That’s fine. Nobody who knows anything about baseball would argue that St. Louis isn’t the nuclear core of the game.
The survey combines the performance of all baseball teams in a city (including college) and a rating based on the cost of going to a game, as well as fan “engagement”.
See if you can spot the inconsistency in the survey.
How does Cleveland, for example, finish as America’s fifth best baseball city while finishing 18th in team performance and tenth in cost and fan engagement? (Note: Cleveland currently has the second-worst attendance in Major League Baseball)
Cullowhee, N.C.? About 10,000 people live there and the median income is about $19,000. Western Carolina University, a constituent campus of the University of North Carolina, calls it home and UNC has produced some pretty fair ballplayers.
Curiously, the same survey ranks Minneapolis as the 26th (out of 30) best baseball city, based only on Major League teams. That’s a pretty lousy ranking for a city whose team has the second-best record in the American League, Wallet Hub.
And Minneapolis doesn’t come up as either best or worst in any other category in the survey — performance of college teams, ticket price, stadium accessibility, and friendly and engaged fans.
Here’s the methodology in the survey:
Teams & Performance – Total Weight = 5
Number of MLB & NCAA Division 1 Baseball Teams: Full Weight
Performance Level of Teams (Number of Wins Divided by Total Games Played): Double Weight
Note: Past three seasons’ averages for MLB and NCAA Division 1 baseball teams were used for this calculation.
Number of Championships Won: Full Weight
Note: Includes both MLB & NCAA Division 1 championships
Number of Division Championships Won: Half Weight
Note: Includes both number of division championships MLB team has won and number of conference championships NCAA Division 1 team(s) has won
Franchise Value (Team Estimated Value in $Million): Half Weight
Note: For MLB teams onlyCosts & Fan Engagement – Total Weight = 5
Average Ticket Price for an MLB Game & Minimum Season Ticket Price for an NCAA Division 1 Baseball Game: Double Weight
Number of Sports Bars per Capita: Half Weight
Fan Friendliness & Engagement (Number of Twitter Followers Plus Number of Facebook “Likes” per Capita): Full Weight
Stadium Accessibility (Stadium Capacity Divided by City Population): Half Weight
Attendance (Average Home-Fan Attendance Divided by Arena Capacity): Half Weight
Note: For MLB teams only
Viewership Rate (Number of Viewers on National TV per Capita): Half Weight
Note: For MLB teams only

